Post by SKYSUMMIT on Dec 30, 2020 8:48:00 GMT -6
I copied this from a post thermalwind - Touro made on 12/30/2020 in advance of a severe weather system that was going to track across Louisiana. Here's a great explanation of what to look for in forecast sounding data:

So there's a lot here I realize, and all of it is somewhat useful but really for your purposes there's no reason to know what things like the BRN means.
What you're really looking for is the instability (chart with green and red lines), shear, and the shape of the hodograph at the top right.
A)
I'll start with the easier stuff to see, checking the values on the shear.
You can see it gets broken down into different layers, some from the ground to just 1 km up and some all the way up to the stratosphere. Shear is the result of different speed and direction of wind at different levels of the atmosphere. The greater the shear, the more an updraft is tilted. This tilt means the updraft can keep pulling in warm air because it's dumping all the cooled air off behind it. If the updraft just went straight up, it would dump it's cold air back to the ground and pull it in, which would kill the storm. Being able to separate the updraft from the downdraft allows for storms to organize and persist.
Typically you want at least 35 kts 0-6 km shear to support supercells. This model sounding has over 50 kts, which is plenty enough. Sustaining the updraft also allows for the updraft to start spinning for reasons more complicated than I care to dive into right now.
B)
Another thing to look at in the numbers is the SRH or Storm Relative Helicity. To keep it simple, it's basically how spinny the air getting pulled into the updraft of a supercell is. Positive values mean you have warm air moving into the storm environment and negative values mean cold air is. You can have very high numbers (300+ for the 0-1 km) without tornadoes because this more or less tells you the rotation potential of a supercell but doesn't mean there will be a supercell to take advantage of it.
Typically over 100 is enough for a higher tornado threat with supercells for the 0-1 km number, and over 250 for the 0-3 km is enough for that higher tornado risk.
This model sounding has 260ish for both, so increased tornado risk if supercells do develop.
C)
Instability
You can have the shear available and still have no storms though, if the airmass is too stable. This is where the chart with the red, green, and dotted lines come into play and how we get those CAPE (Convective Available Potential Energy) values you'll see talked about.
First, the red line, which shows the temperature of the atmosphere at a certain pressure level. You'll see the temperature drops as you go higher. The rate it drops ends up being important.
Second, the green line, which shows the dew point temperature (measure of moisture) of the atmosphere all the way up to the stratosphere.
Third, the dotted line, which shows a hypothetical parcel of air that is taken from the surface and raised up. This part is a little tricky, because we have to go back to high school chemistry.
You probably remember PV = nRT, the Ideal Gas Law. The important bit is P and T are on opposite sides of the equal sign, which means temperature will drop as pressure drops without adding or taking away any heat. This is what we assume our parcel of air does, just has the pressure dropped as it rises and the temperature drops. Also, once the dew point = temperature of the parcel it will see a slower drop in temperature.
You don't even need to understand all of that to be able to read the chart, but it's helpful. What matters is the space between the red line and that dotted line. If the dotted line is to the right, that space between it and the red line means instability and more convective potential. If it's on the left side of the red line, this means the air sinks and no convection. The "fatter" the area is, the faster the air can rise and the higher the CAPE value. For severe weather, faster updrafts typically yield stronger storms.
It doesn't take much to produce severe weather if there's enough shear. The Nashville tornado back in March only had maybe 1000 J/kg of CAPE to work with.
I do like to look at that 3CAPE number, which is low level instability. The larger the number, the faster the updraft at the bottom where the strongest rotation potential typically is located.
D)
Hodograph Shape
This is the thing at the top right. I'll do a deep dive on it sometime here soon to flesh it out if y'all want to know more. It plots the wind speed and direction and different heights. The shape can tell you a lot. A cluster of points, you're typical afternoon thunderstorm in the summer. A straight line? Tends multicelluar. A long curve? Supercell potential.
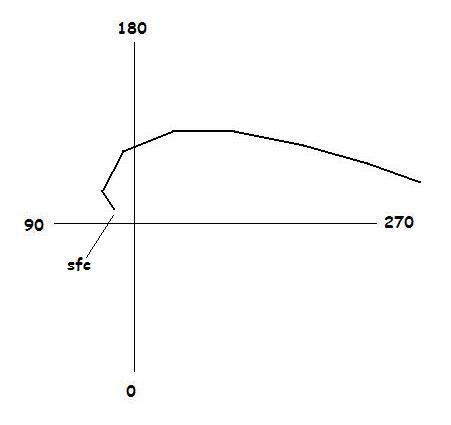
Above image from www.wxonline.info/topics/hodograph.html
These are the main things I'm looking at when I see these model produced soundings. How much convective potential is there? How much shear is there? Is the wind profile such to support supercells (hodograph)? You can figure out a lot, just with the basics I've explained (or tried to at least) above.
Ask any questions you might have, and if this sort of thing interests enough of you, I might do future posts explaining weather stuff in the future.

So there's a lot here I realize, and all of it is somewhat useful but really for your purposes there's no reason to know what things like the BRN means.
What you're really looking for is the instability (chart with green and red lines), shear, and the shape of the hodograph at the top right.
A)
I'll start with the easier stuff to see, checking the values on the shear.
You can see it gets broken down into different layers, some from the ground to just 1 km up and some all the way up to the stratosphere. Shear is the result of different speed and direction of wind at different levels of the atmosphere. The greater the shear, the more an updraft is tilted. This tilt means the updraft can keep pulling in warm air because it's dumping all the cooled air off behind it. If the updraft just went straight up, it would dump it's cold air back to the ground and pull it in, which would kill the storm. Being able to separate the updraft from the downdraft allows for storms to organize and persist.
Typically you want at least 35 kts 0-6 km shear to support supercells. This model sounding has over 50 kts, which is plenty enough. Sustaining the updraft also allows for the updraft to start spinning for reasons more complicated than I care to dive into right now.
B)
Another thing to look at in the numbers is the SRH or Storm Relative Helicity. To keep it simple, it's basically how spinny the air getting pulled into the updraft of a supercell is. Positive values mean you have warm air moving into the storm environment and negative values mean cold air is. You can have very high numbers (300+ for the 0-1 km) without tornadoes because this more or less tells you the rotation potential of a supercell but doesn't mean there will be a supercell to take advantage of it.
Typically over 100 is enough for a higher tornado threat with supercells for the 0-1 km number, and over 250 for the 0-3 km is enough for that higher tornado risk.
This model sounding has 260ish for both, so increased tornado risk if supercells do develop.
C)
Instability
You can have the shear available and still have no storms though, if the airmass is too stable. This is where the chart with the red, green, and dotted lines come into play and how we get those CAPE (Convective Available Potential Energy) values you'll see talked about.
First, the red line, which shows the temperature of the atmosphere at a certain pressure level. You'll see the temperature drops as you go higher. The rate it drops ends up being important.
Second, the green line, which shows the dew point temperature (measure of moisture) of the atmosphere all the way up to the stratosphere.
Third, the dotted line, which shows a hypothetical parcel of air that is taken from the surface and raised up. This part is a little tricky, because we have to go back to high school chemistry.
You probably remember PV = nRT, the Ideal Gas Law. The important bit is P and T are on opposite sides of the equal sign, which means temperature will drop as pressure drops without adding or taking away any heat. This is what we assume our parcel of air does, just has the pressure dropped as it rises and the temperature drops. Also, once the dew point = temperature of the parcel it will see a slower drop in temperature.
You don't even need to understand all of that to be able to read the chart, but it's helpful. What matters is the space between the red line and that dotted line. If the dotted line is to the right, that space between it and the red line means instability and more convective potential. If it's on the left side of the red line, this means the air sinks and no convection. The "fatter" the area is, the faster the air can rise and the higher the CAPE value. For severe weather, faster updrafts typically yield stronger storms.
It doesn't take much to produce severe weather if there's enough shear. The Nashville tornado back in March only had maybe 1000 J/kg of CAPE to work with.
I do like to look at that 3CAPE number, which is low level instability. The larger the number, the faster the updraft at the bottom where the strongest rotation potential typically is located.
D)
Hodograph Shape
This is the thing at the top right. I'll do a deep dive on it sometime here soon to flesh it out if y'all want to know more. It plots the wind speed and direction and different heights. The shape can tell you a lot. A cluster of points, you're typical afternoon thunderstorm in the summer. A straight line? Tends multicelluar. A long curve? Supercell potential.

Above image from www.wxonline.info/topics/hodograph.html
These are the main things I'm looking at when I see these model produced soundings. How much convective potential is there? How much shear is there? Is the wind profile such to support supercells (hodograph)? You can figure out a lot, just with the basics I've explained (or tried to at least) above.
Ask any questions you might have, and if this sort of thing interests enough of you, I might do future posts explaining weather stuff in the future.


